Practice Mode • Task 1
Unlimited time
WRITING TASK 1
Ctrl+QYou should spend about 20 minutes on this task.
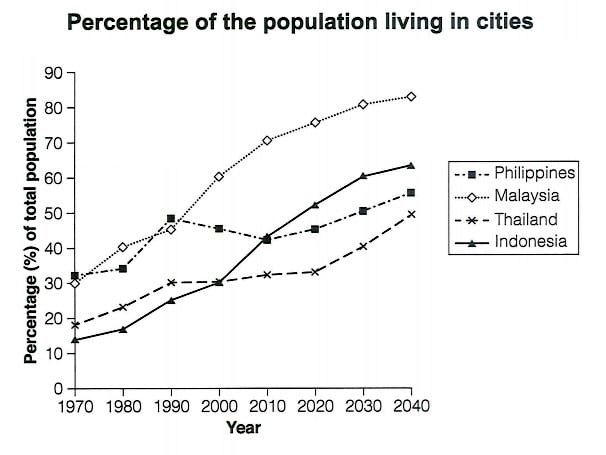
The graph below gives information about the percentage of the population in four Asian countries living in cities from 1970 to 2020, with predictions for 2030 and 2040. Summarise the information by selecting and reporting the main features, and make comparisons where relevant.
Write at least 150 words.
Diagram
Your Response
0 words (recommended: 150+)
WRITING TASK 1
Instructions
You should spend about 20 minutes on this task.
Question
The graph below gives information about the percentage of the population in four Asian countries living in cities from 1970 to 2020, with predictions for 2030 and 2040. Summarise the information by selecting and reporting the main features, and make comparisons where relevant.
Write at least 150 words.
Diagram
Your Response
0 words (recommended: 150+)